











Marketing dashboards have a strange ability to make everyone feel informed while changing almost nothing. You can have twenty charts, green arrows, weekly reports and a room full of people looking at the same screen, then end the meeting with no decision at all.
The problem is usually not the visualization tool. It is that the dashboard was built around the data that exists instead of the decisions the business needs to make. A good dashboard should reduce debate about what happened and increase clarity about what happens next.
Why do so many marketing dashboards fail?
Because reporting and decision-making are treated as the same job. Reporting asks “what happened?” Decision-making asks “so what, why, and what should we do?” A dashboard that only answers the first question is useful for record keeping, but weak as a management tool.
BCG’s 2025 global marketing-measurement research found that leading organizations simplify around one or two north-star KPIs, distinguish strategic from tactical measures, and connect marketing metrics to business outcomes. The point is not to have fewer data points everywhere. It is to create a hierarchy so the right person sees the right level of evidence.
If a metric cannot change a decision, ask why it needs to be on the main dashboard.

What should a marketing dashboard actually do?
A decision-ready dashboard should help someone do at least one of four things: allocate money, change execution, investigate a problem or decide whether to continue a strategy. If a chart has no relationship to one of those actions, it probably belongs in a deeper report, not on the main screen.
| Dashboard question | Example decision |
|---|---|
| Are we creating profitable growth? | Increase, hold or reduce investment. |
| Where is the customer journey breaking? | Fix the page, offer, sales handoff or onboarding. |
| Which channel is doing its assigned job? | Change budget, creative, audience or channel role. |
| Are leading indicators moving before revenue? | Keep course, investigate or run a test. |
| Did the change cause the result? | Scale an experiment or avoid false attribution. |
Start with the decision list, not the KPI list
Before opening Looker Studio, Power BI, Tableau or a spreadsheet, write down the recurring decisions the dashboard is supposed to support. That one step removes a surprising amount of clutter.
- List the decisions. Examples: shift media budget, pause a campaign, change an offer, prioritize a product, adjust a market, investigate retention, increase brand investment or escalate a conversion problem.
- Name the decision owner. A CEO, CMO, performance marketer and CRM lead need different depth. One dashboard can feed several views, but not every user needs every metric.
- Define the evidence. For each decision, ask what outcome proves success, what leading indicators explain movement and what diagnostic metrics help identify the cause.
- Set the cadence. Some metrics belong in daily operational checks, others in weekly reviews, and some only make sense monthly or quarterly. Frequency should match how fast a decision can realistically change.
- Write the action rule. If this metric moves outside the expected range, what should happen? Investigate, reallocate, test, stop or simply keep watching?
Build the dashboard in three layers
The easiest way to stop a dashboard becoming a wall of numbers is to separate the layers of measurement.
| Layer | Purpose | Examples |
|---|---|---|
| 1. Business outcomes | Shows whether marketing is contributing to the business result. | Revenue, qualified pipeline, contribution margin, profitable orders, retention, CLV. |
| 2. Customer + journey indicators | Shows whether customer behavior is moving in the right direction. | Consideration, qualified traffic, conversion, repeat purchase, activation, branded search. |
| 3. Channel diagnostics | Shows why a specific activity is or is not working. | CTR, CPM, CPC, view-through, frequency, creative response, email deliverability, landing-page speed. |
The third layer can contain many metrics because operators need detail. The first layer should be brutally selective. Leadership does not need to see every channel metric to make a budget or growth decision.
Check out what our CEO is writing about: What most people don’t communicate in presentations

What context should sit next to every important metric?
A number without context creates unnecessary interpretation. Give the metric enough information to answer whether the change is meaningful.
| Context | Why it matters |
|---|---|
| Current value | What is happening now. |
| Target / expected range | Whether performance is actually good or bad. |
| Previous period / baseline | Whether it is improving, declining or simply normal. |
| Trend | Whether one unusual day is being mistaken for a pattern. |
| Owner | Who is responsible for investigating or acting. |
| Reason / annotation | Launch, price change, stock issue, tracking break, seasonality or another event that explains movement. |
| Next decision | The action the metric is expected to inform. |
How many KPIs should the main dashboard have?
Fewer than most teams think. There is no universal number, but the main view should be small enough that a decision-maker can understand the story without scrolling through twenty equally important charts. BCG’s measurement research describes leading teams using one or two north-star KPIs as a shared currency, with other measures cascading underneath.
This does not mean the business only measures two things. It means the hierarchy is clear. The top of the dashboard answers whether the strategy is working. The lower layers explain why.
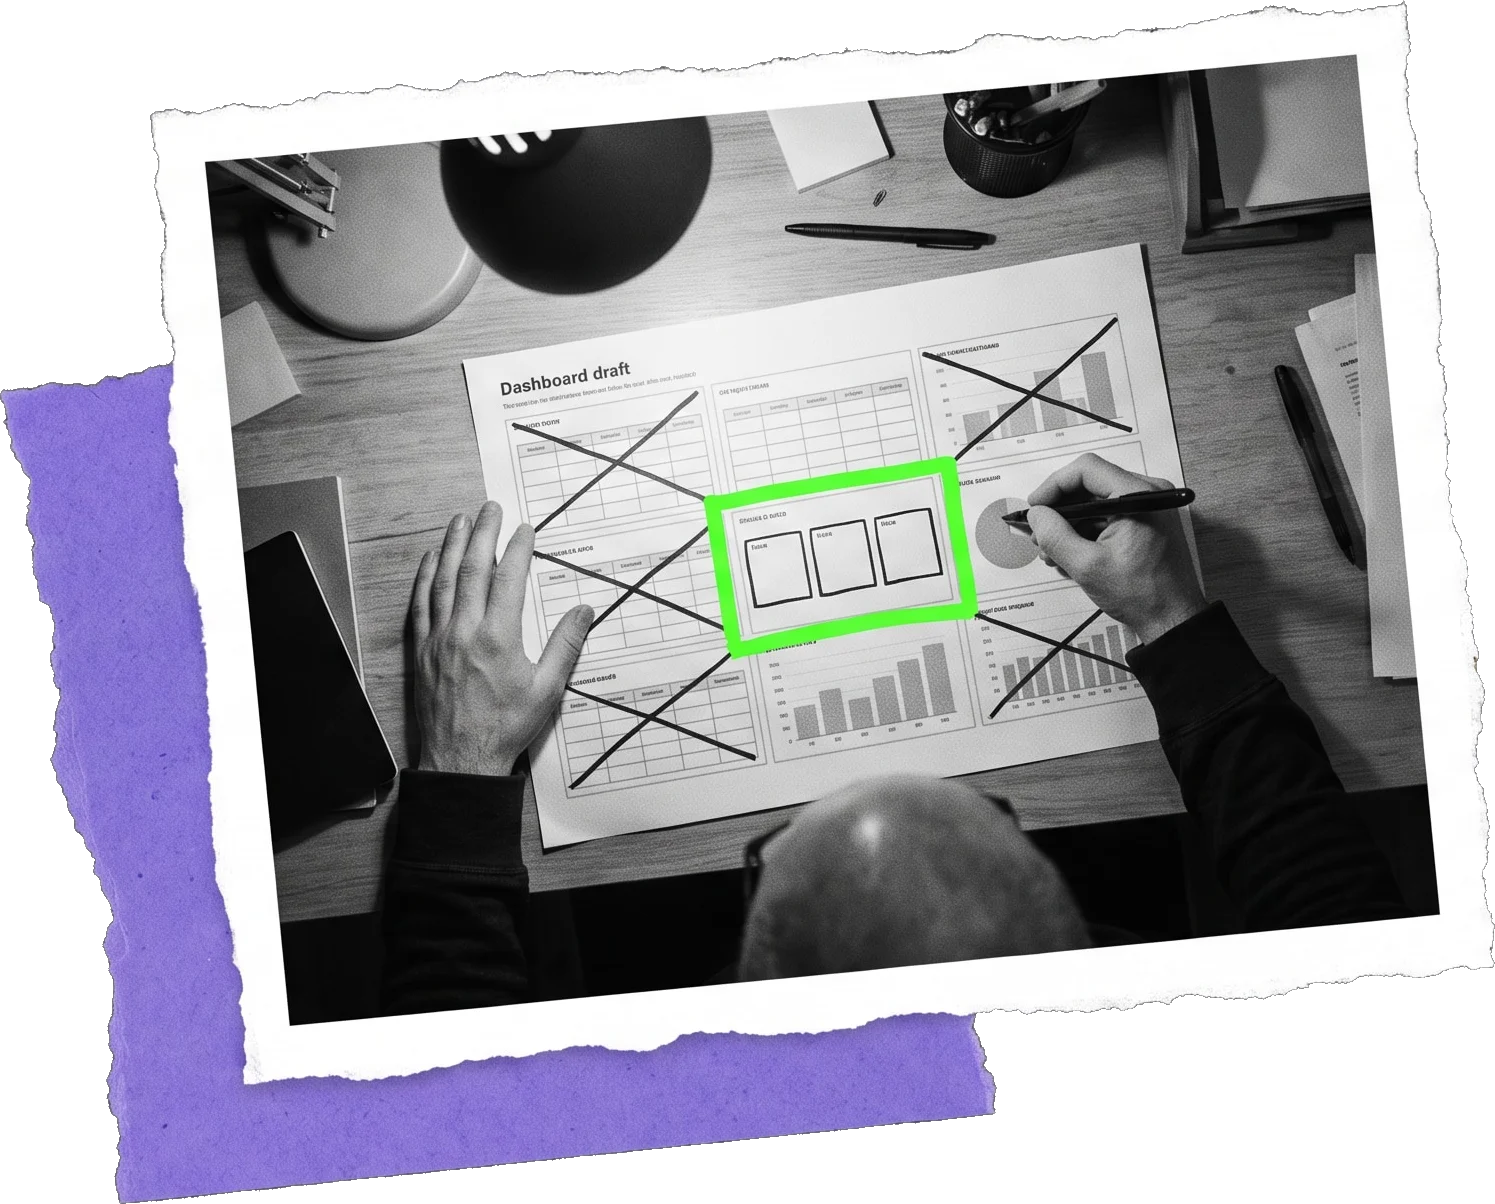
Which metrics should never stand alone?
- ROAS. Useful for a specific paid-media view, but weak as a complete business measure if margin, new-vs-existing customers, incrementality or offline effects are ignored.
- Revenue. Strong outcome metric, but it cannot explain whether growth came from marketing, price changes, distribution, seasonality or existing demand.
- Traffic. A rise can be valuable or worthless depending on quality, conversion, product mix and customer intent.
- Engagement. Useful for creative and audience diagnosis, but not a substitute for customer or business outcomes.
- Last-click conversions. Helpful operationally, but they assign credit to the final observed touchpoint rather than proving what caused the sale.
- Brand awareness. Important when brand is part of the growth strategy, but it should be connected to consideration, demand or longer-term commercial outcomes rather than treated as a decorative score.
How should you combine attribution, incrementality and marketing mix modeling?
Do not expect one measurement method to answer every question. Google’s 2025 measurement guidance recommends a portfolio approach using first-party data, marketing mix modeling, incrementality testing and data-driven attribution. BCG reaches a similar conclusion: leading marketers integrate multiple methods rather than searching for one perfect source of truth.
| Method | Best for | Be careful about |
|---|---|---|
| Attribution | Daily / channel optimization and observed journeys. | Credit is not the same as causality. |
| Incrementality | Testing whether an activity caused additional outcomes. | Requires good experiment design and enough volume. |
| MMM | Strategic budget allocation across channels and longer time periods. | Needs robust data and should not replace day-to-day diagnostics. |
| Brand tracking | Monitoring awareness, consideration and perception. | Connect it to future demand or strategic decisions where possible. |
A simple dashboard review format
Instead of presenting every chart, structure the meeting around the exceptions and decisions. The dashboard is the evidence, not the agenda.
- What changed? Call out only material movements, not every metric.
- Why do we think it changed? Separate known causes from hypotheses.
- Does it change the business outlook? Connect the movement to the agreed outcome.
- What decision is needed? Keep, adjust, test, stop, reallocate or investigate.
- Who owns the next move and when do we review it? Close the loop before the meeting ends.
McKinsey’s 2025 CMO research makes the business problem clear: 70% of CEOs in its survey said they judge marketing by revenue growth and margin, while only 35% of CMO respondents tracked those as top metrics. A dashboard can help close that gap only if the measurement hierarchy makes the link between operational marketing activity and business outcomes visible.

What should you remove from the dashboard?
Remove metrics that are duplicated, metrics nobody acts on, vanity totals with no target, charts whose timeframe does not match the decision, and numbers that appear precise but depend on weak attribution assumptions. Keep them in the analytics layer if somebody needs them. They do not all deserve executive real estate.
A dashboard is not successful because it contains more data. It is successful when the team can see what matters, understand the movement and make the next decision faster.